Powerful Reporting for SugarCRM
You likely have massive amounts data in your CRM, but do you have the ability to extract it in a meaningful way? You may have tried various other reporting tools that were clunky, required in-depth technical knowledge, or simply never worked.
We understand your pain so we created the Sapiens.BI which has quickly become the most popular reporting tool for SugarCRM.
Take a look at our features below, request a demo, and start your free trial today. We have included over 100 pre-built reports to help you get started right away.
On SugarCRM Pro or Ultimate?
Check out our Sapiens.BI PRO add-on: https://marketplace.sugarcrm.com/addons/analytic-pro Works great for both On Demand and On Premise environments.
PRO vs Basic - version comparison
Features
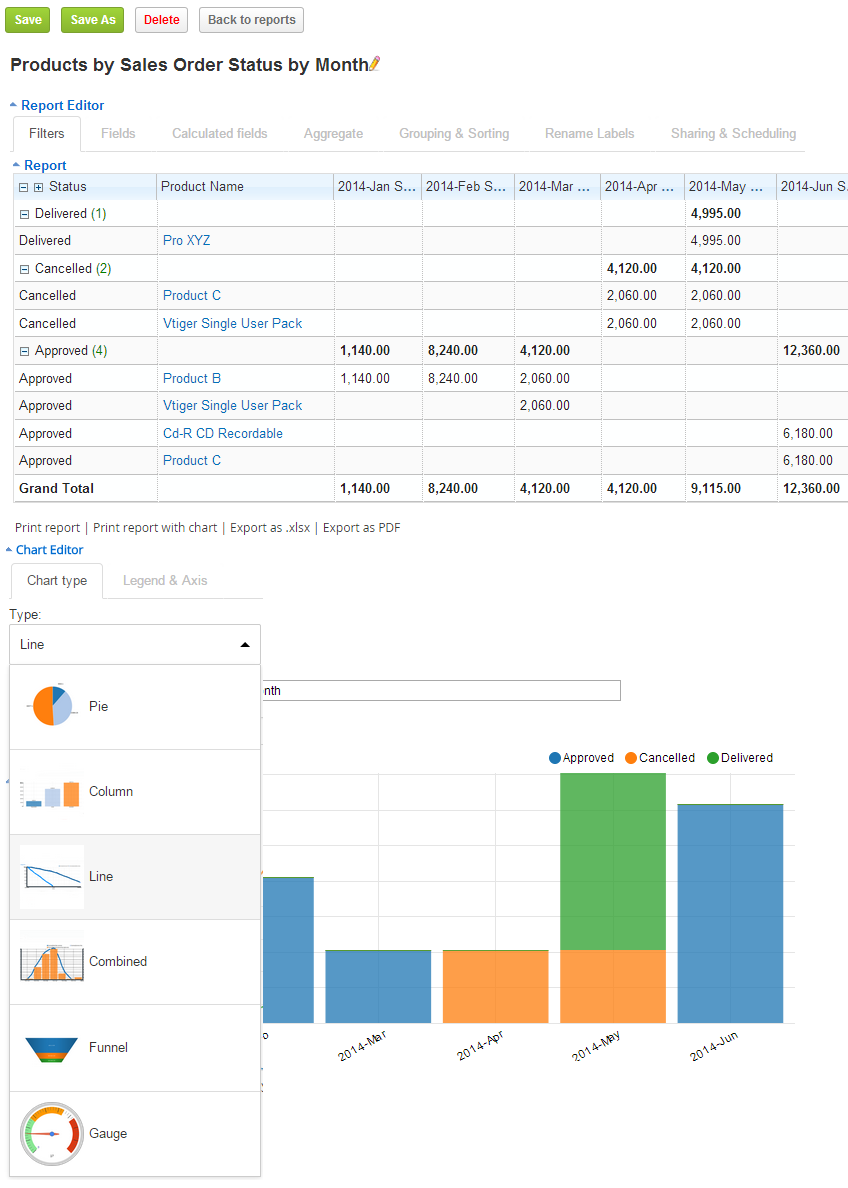
Pivot, grouped summary, grouped detailed and simple detailed report types available, easily switch between different report types
You can modify your reports and charts: filters, sorting and grouping criteria
Add charts to dashboards
Sample reports are available for each Report type and various SugarCRM modules and their related modules
Unlimited levels of groups and summaries within a report
Compatible with SugarCRM Standard and Custom Modules
Quick and easy installation - simply upload through the module loader and everything is ready for use!

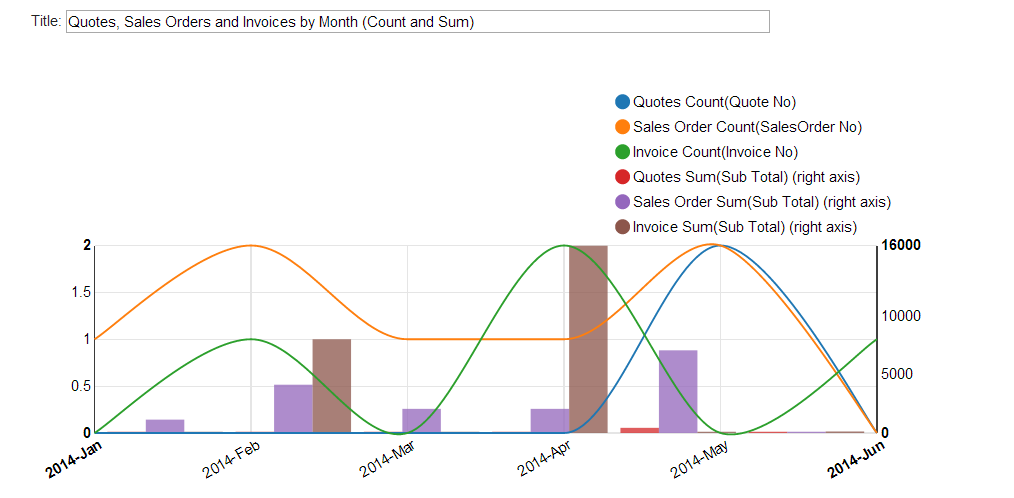
Combined chart with 3 axes (2 vertical axes): for comparison of different scales, e.g. Count and Sums:

Reports and Charts have lots of customization options.
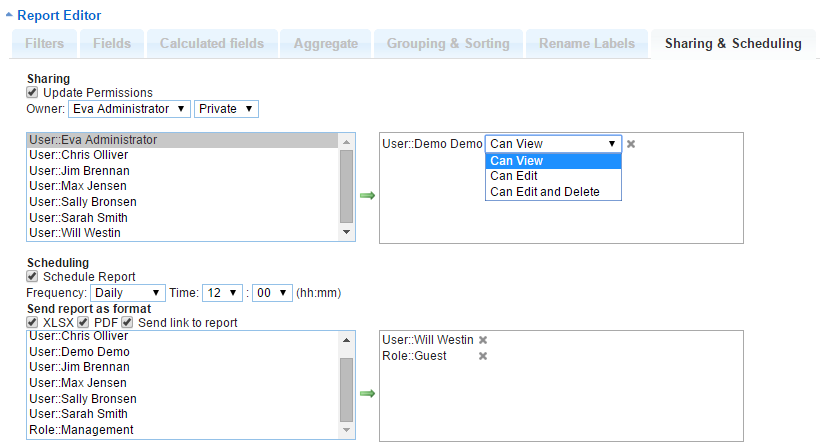
Reports can be exported in Excel and PDF formats and they can be scheduled via e-mail as PDF and Excel attachments, and/or Links to the reports. PDF and Excel e-mailed reports are real-time, i.e. if your report has the filter set to Last Month and runs monthly, it will e-mail the previous month's data every time it is run.

Mass-edit feature for Permissions and E-mail Scheduling: you can select several reports at a time and update Permissions and Scheduling for all selected reports.

