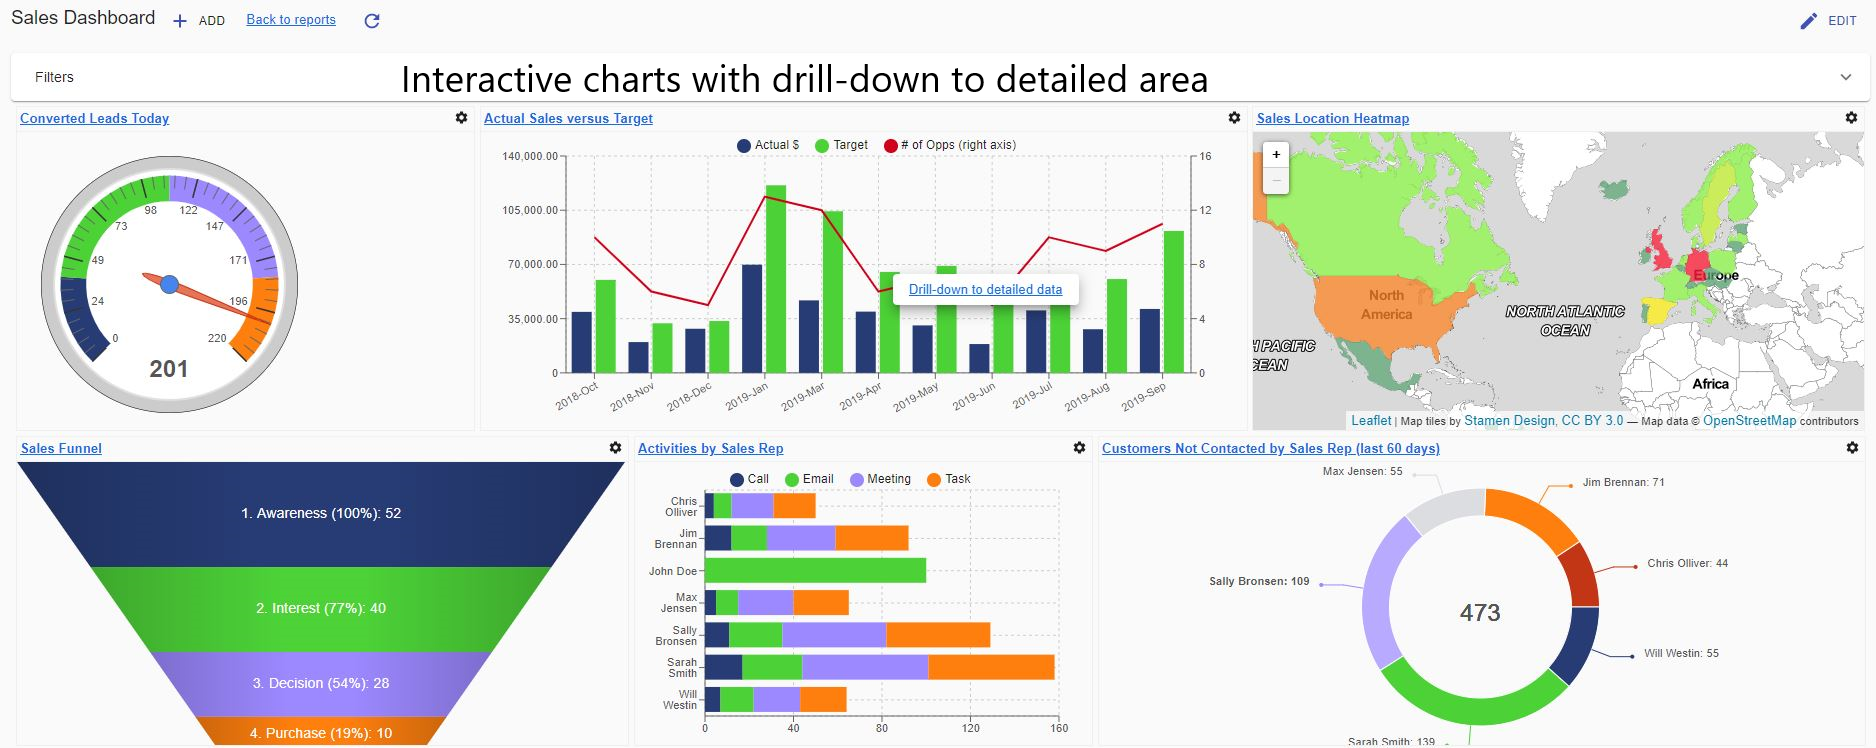
As data analysts immersed in numbers and figures, it is sometimes easy to forget how the human brain functions. It works best with visual cues and stories. Charts help you bridge that gap and tell an easy-to-understand story. To take it a step further, they empower you to see the big picture by looking at a single dashboard and sales pipeline, plus monitor any other Key Performance Indicators (KPIs) crucial to your unique business goals.
Dashboards: the key Sugar reporting feature

Dashboards are an amazingly practical way to see all your KPIs in one spot. They allow you to make data-driven decisions, get insights into your team’s performance and sales pipeline, and monitor any other KPI that is important to your business.
Using Sapiens.BI analytic reporting for Sugar, you can easily set up dashboards with:
- Interactive charts that allow you to see real-time data and drill-down to get more details
- Common filters allow you to filter match criteria across several charts simultaneously
- Charts with 3 axes allow you to compare different scales and see how they correlate over time (e.g. opportunity count and converted dollar amount)
- Gauge charts make it easy to see your performance according to set KPIs
- Geographic charts help you view the location of your sales and activities
Video Tutorial 1: Creating Combined Charts
With combined charts, you can add a second vertical axis and even stack your data.
Video Tutorial 2: Creating Interactive Dashboards
Video Tutorial 3: Sugar Native Dashboards
More powerful reporting features for your SugarCRM
Sapiens.BI is a business intelligence tool that offers a wide range of data analytics features:
- Create customizable layouts and combine several reports to export/email schedule as PDF/Excel attachments
- Snapshots to analyze business trends over time
- Filter data based on Counted and Summary Values
- Access and relate any modules (e.g. Custom modules, Change / Audit log)
- Calculate your own functions and add data ranges to your reports to track KPIs
- Live data: Sapiens.BI is fully integrated into SugarCRM
As a user-friendly analytics solution with over 100 reports available upon installation, it takes just 1 minute to start gaining valuable business insights from your data. You can book live training sessions, plus premium support is included starting from the first day of your free trial. The team at Sapiens.BI also offers a wide range of video tutorials so you can learn at your own pace.
Learn more about Sapiens.BI and how this leading reporting integration can give you the quality visuals you need to make quick, informed business decisions.
-
PhoneBurner for Sugar: Power Dialer
FEATUREDIntegrate Sugar with PhoneBurner. Boost call volume and live client interactions with our Sugar power dialer. Dial leads live (no awkward pause), leave pre-recorded voicemails, send 1-click emails, se... -
SalesRoller
Link **Xero Cloud Accounting** and **SugarCRM** for the full 360 degree view of your customer information. - Show more addons


