User Guide
Usage
SynoOrgChart makes use of Sugar Dashlets to present contextual information.
Adding A SynoOrgChart Dashlet
New dashlets created by SynoOrgChart are available on Accounts and Contacts detail views via the dashboard on the right of the screen.
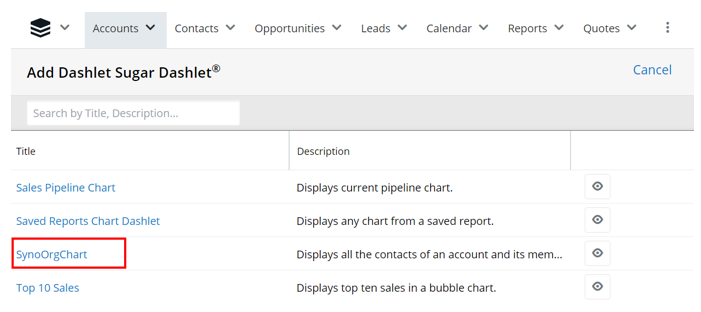
To add a new dashlet, click "add Dashlet"

Select SynoOrgChart from the list of available dashlets.
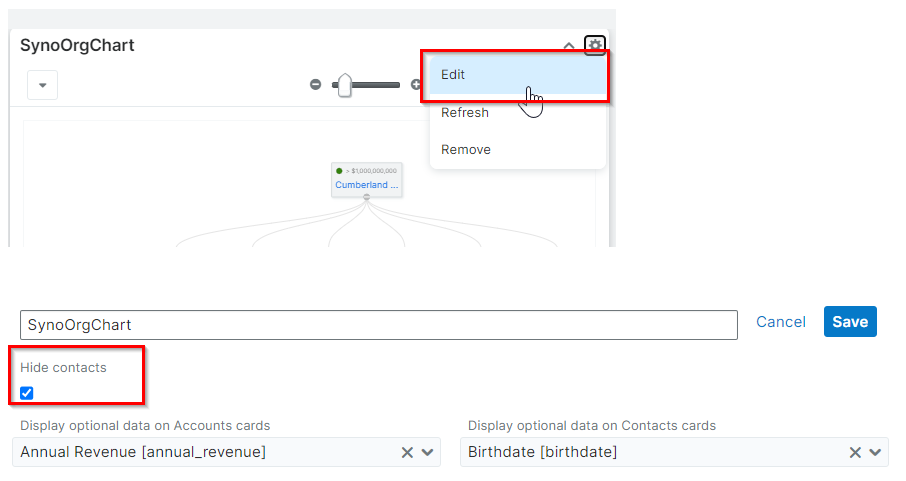
Once the dashlet is selected, save it to add it to the column. You can choose at this step if you want to hide contacts (for example in accounts) as well as if you want to display additional fields (accounts and contacts).

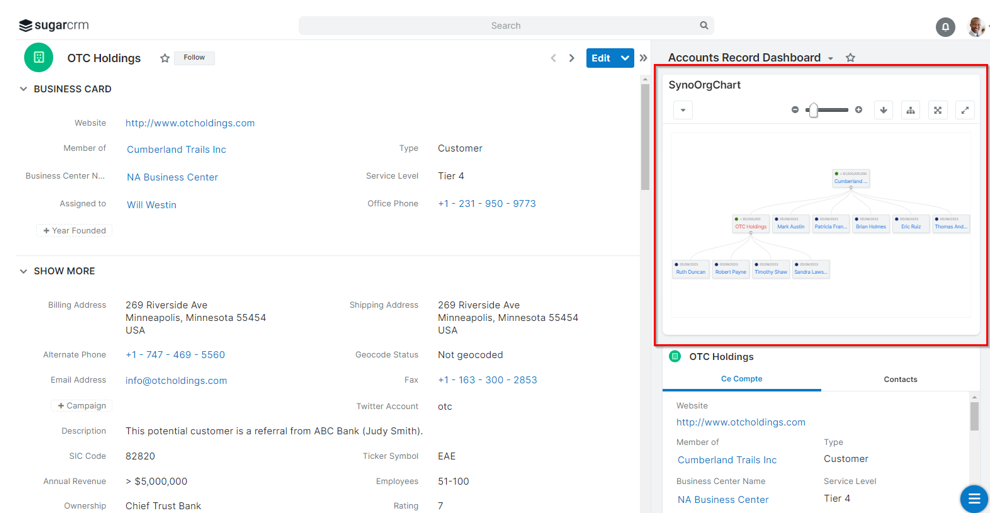
Display of SynoOrgChart Dashlet
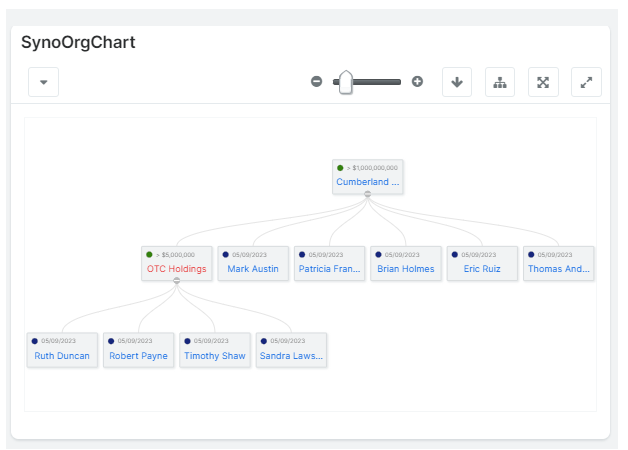
The SynoOrgChart dashlet displays the hierarchy for an Account or a Contact and looks for the highest-ranking Contact record.
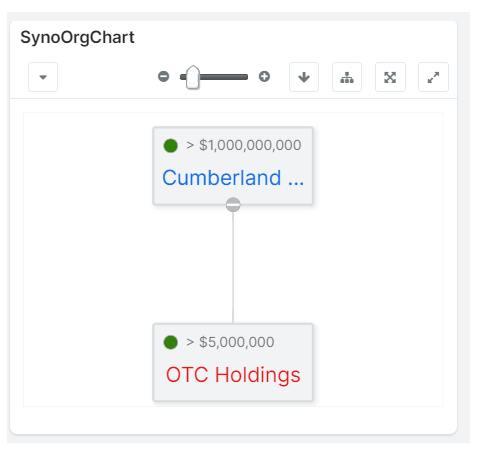
The red node in the tree is the currently-selected record. The team security is disabled to display the full organizational chart of the company.
Hide Contacts
From the configuration of a OrgChart Dashlet you can select if you want to display or not the linked Contacts. This is usefull if the organisation has a lot of Contacts.
Example :
Display of optional fields
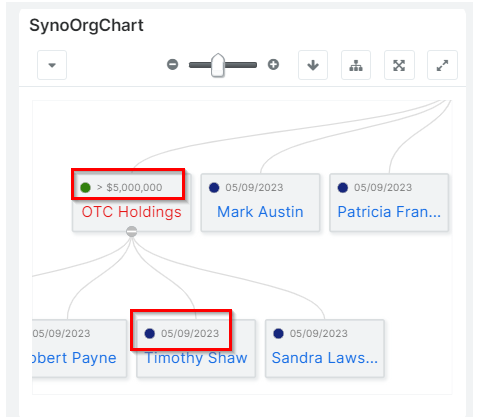
It’s possible to select two optional fields when configuring the dashlet, one on accounts and one on contacts.

They are displayed in the tree as follows :
Hierarchy of contacts
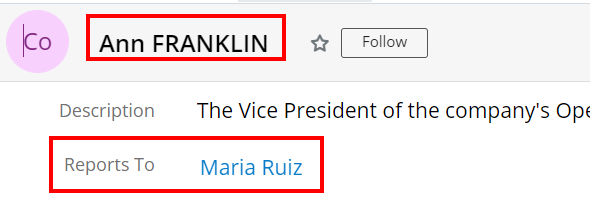
The hierarchy between the contacts is taken into account in the tree structure.
Navigation Tools
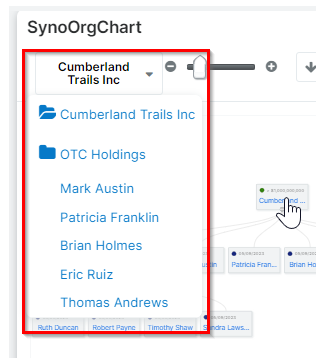
SynoOrgChart has four tools to help you navigation between nodes of the tree. Note that clicking and dragging the mouse and the scrolling will move the tree in the dashlet pane, allowing you to navigate.
Browsing Records
Records are represented as child nodes within the tree. When you click on an item, regardless of its type, the view is updated to display data solely related to the selected record.
Zoom
The zoom toolbar works the same result as the mouse scroll wheel. Using the "-" button and "+" button or the slider you can adjust your zoom level for the dashlet panel.

Reset Zoom
Once the zoom has been changed, it is possible to reset it by clicking on the dedicated button.

Tree Orientation
The arrow button redraws the tree vertically or horizontally to accommodate your preference.
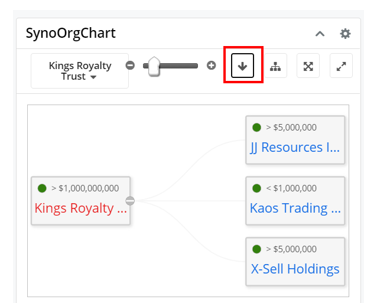
Expanding The Tree/Displaying All Nodes
The Display of all Nodes button expands each element of the graphical tree that contains child elements to display the entire tree and all its children.

Full screen view
The full screen mode allows for a better view of the chart, when it has a lot of elements or a complex structure. All the features are still available on a bigger display view while still remaining on the current record.

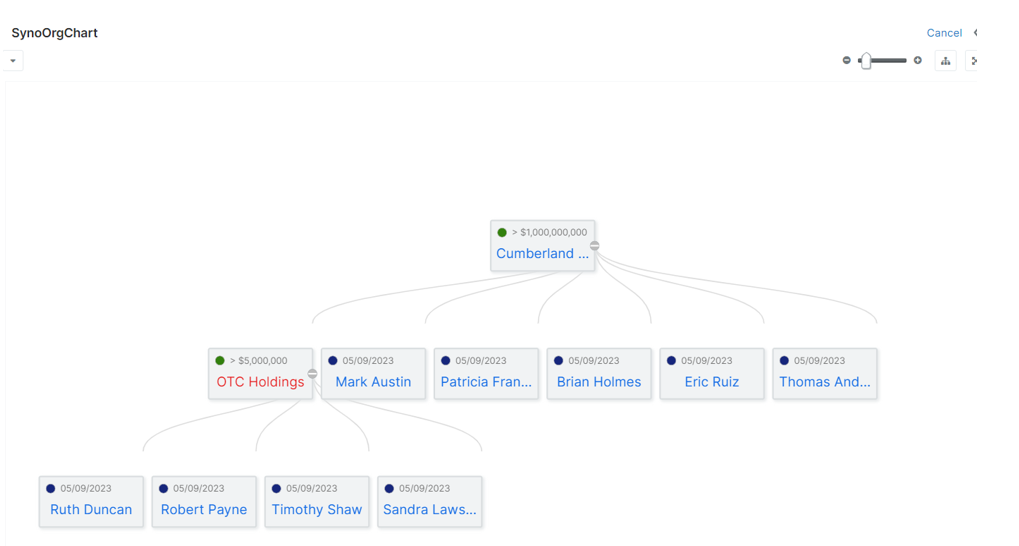
The full screen mode is based on the « drawers » system of Sugar with its own features such as masking the preview zone, resize the drawer and click on “Cancel” to close the drawer and come back to the current record.
Collapsing/Expanding Nodes
The "+/-" button when on a node indicates whether the item has child nodes. Clicking it will hide or show those child nodes if they are expanded or collapsed.

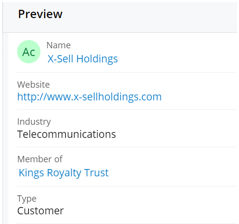
Node Previews
The preview displays just on top of the dashlet and can be closed without affecting your position in the tree.
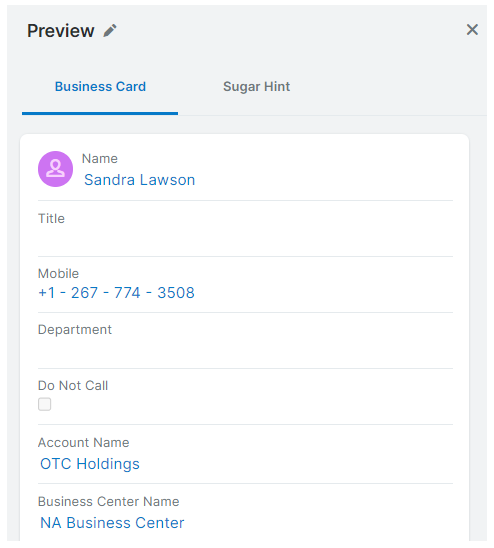
Synolia
SYNOLIA has deep expertise with Customer Resource Management (CRM) applications that enables us to help businesses, according to specific needs, building the best of breed solution. Historical first partner of SugarCRM since 2004, Recognized developer and Elite partner of SugarCRM, first European partner in 2009, SYNOLIA provides support and services to customers in order to define or deploy projects with SugarCRM. Synolia is based in Lyon, Paris, Bordeaux & Grand-Ouest, FRANCE.
For more information call +33 (0)4 27 70 53 70, email sugar@synolia.com, or visit http://www.synolia.com.


